Turbines: Flutter Maps for Standard Configuration 11
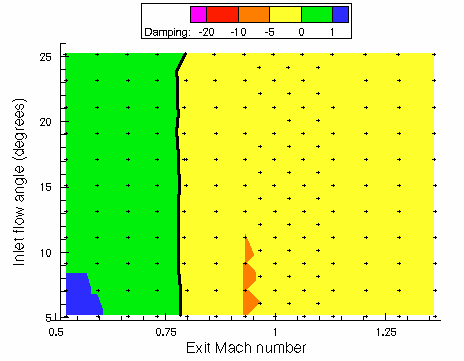
The flutter maps below are constructed from viscous quasi-3D unsteady flow simulations of Standard Configuration 11. The total pressure was assumed to be 229.8 kPa and the total temperature was 340 K. It was assumed that there are 20 tuned blades. This is the number of blades in the experimental facility at the EPFL in Lausanne. The 185 operating points used to construct the flutter maps are plotted on the maps. At each operation point, the aerodynamic dampings for all possible 20 interblade phase angles were calculated and the minimum value is plotted. The subsonic design condition for this Standard Configuration has been defined as: inlet flow angle equal to 15.2 degrees and exit isentropic Mach Number equal to 0.69. Two mode shapes were examined: flap normal to chord and torsion about mid-chord. For each mode shape, three modal frequencies were examined: 180, 212.1 and 250Hz.
Operating Conditions
| Total Pressure | 229.8 kPa |
|---|---|
| Total Temperature | 340 K |
| Number of Tuned Blades | 20 |
Links to results
- Flutter Map for flap mode at 180 Hz
- Flutter Map for flap mode at 212.1 Hz
- Flutter Map for flap mode at 250 Hz
- Flutter Map for torsion mode at 180 Hz
- Flutter Map for torsion mode at 212.1 Hz
- Flutter Map for torsion mode at 250 Hz
Flutter Map for flap mode at 180 Hz
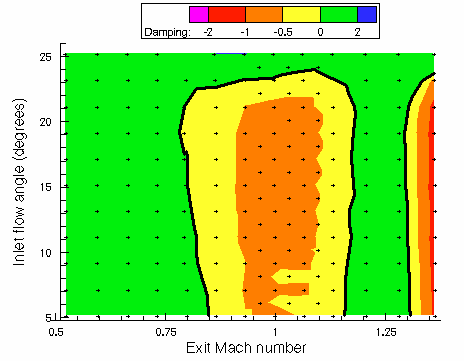
Flutter Map for flap mode at 212.1 Hz
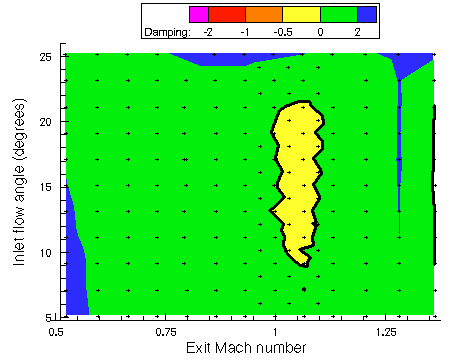
Flutter Map for flap mode at 250 Hz
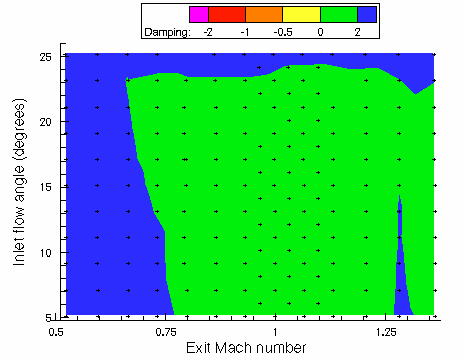
Flutter Map for torsion mode at 180 Hz
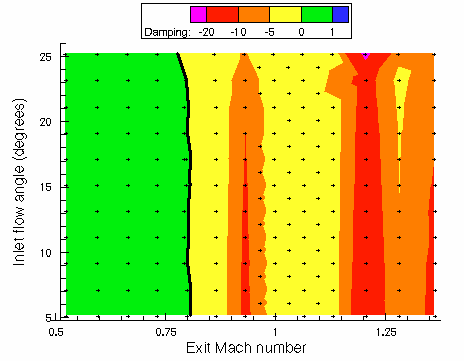
Flutter Map for torsion mode at 212.1 Hz
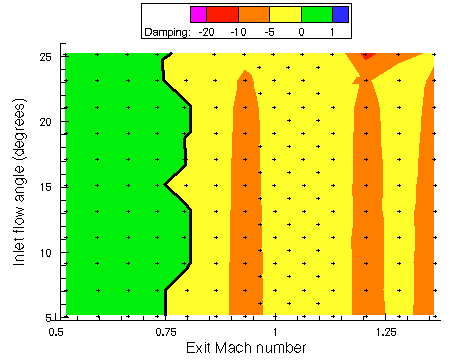
Flutter Map for torsion mode at 250 Hz
